Evaluation of Pharmacokinetic-Pharmacodynamic (PK/PD) Relationships of Anti-Bacterial Agents in Preclinical Models of Infection
Ramesh Jayaraman
Director
DoseQuantics Consulting
INTRODUCTION
The pharmacokinetics (time course of concentration in the body) of a drug when combined with its pharmacodynamics (onset, intensity, duration of pharmacological effect of the drug) determines the therapeutic potential of a drug (1).
For an anti-bacterial drug or molecule, the primary measures of in vitro potency and efficacy are:
1. The Minimum Inhibitory Concentration (MIC): the minimum concentration of the drug that inhibits bacterial growth by ninety percent in vitro.
2. The Minimum Bactericidal Concentration (MBC): the minimum concentration of the drug which causes ninety nine percent killing of bacteria in vitro.
3. Killing kinetics: the relationship between drug concentration and the rates of growth and killing of bacteria over time; a) Concentration dependent killing – the bacterial killing rate increases with concentration over a wide concentration range (e.g. Fluoroquinolones, Aminoglycosides) (2); b) Time dependent (Minimum concentration dependent) killing – the bacterial killing rate increases over a narrow range of concentration and reaches saturation in killing. The killing effect is more related to time than concentration (e.g. Penicillins, beta-lactams, Tetracycline) (2). The killing pattern of bacteria by an anti-infective agent in vitro has been shown to be similar in animal models of infection and in human patients with infections for many classes of antibiotics (2, 3).
The in vivo efficacy (pharmacodynamics (PD)) of an anti-infective drug or molecule in animal models of infection is determined by the combination of its pharmacokinetics (PK) and in vitro potency (MIC, MBC, kill rate). The PK parameters used to evaluate the potential for an anti-infective agent to show efficacy are Cmax (maximum concentration in plasma or blood), AUC24 (Area under the plasma or blood concentration time curve over 24 hours) and the time period over which the plasma or blood concentrations remain over the MIC over 24 h. The ratio of Cmax/MIC, AUC24/MIC and %T>MIC are known as the PK/PD parameters that can be used to characterise anti-infective efficacy.
The three PK/PD parameters that determine the therapeutic efficacy of anti-bacterial drugs in preclinical models of infection and in the clinic are
a) The ratio of area under the free drug concentration time curve to the MIC (fAUC/MIC);
b) The ratio of peak free drug concentration to the MIC (fCmax/MIC);
c) The time of free drug concentration above the MIC (T>MIC) (3, 4, 5).
Preclinical models of infection, such as the neutropenic thigh and lung infection models in mice, have predicted the clinical efficacy of different classes of antibiotics with a good degree of accuracy (3, 6, 7, 8).
The neutropenic mouse thigh infection model has been the workhorse for evaluating the PK/PD of anti-bacterial agents in drug discovery programs. The major objective in the nonclinical phase is to determine the PK/PD parameter that best describes the efficacy of the clinical candidate in the animal model of infection. The rationale for this is to set PK/PD targets in the clinic to achieve clinical efficacy in patients. The US FDA has issued a guidance document emphasizing the requirement for characterizing the PK/PD of an anti-bacterial drug in nonclinical models of infection and identification of the PK/PD index and magnitude that best describes and quantifies its efficacy (9).
The PK/PD of an anti-bacterial clinical candidate (identified following lead optimization), is characterized to identify the PK/PD index and to set a target that is predictive of efficacy in clinical trials. However, PK/PD is not sufficiently characterized at the lead identification stage of the program. It is important to identify PK/PD relationships for lead compounds to understand the relationships between in vitro potency (target, cell), PK and efficacy for the following reasons
a) Identification of intrinsic efficacy and potency of the lead compound belonging to a specific chemical series.
b) Identification of parameters for improvement of lead compound (potency, PK, safety) in the lead optimization phase
c) To facilitate a stop/go decision for a lead series – Lack of PK/PD relationships can be due to inability of compound to reach site of infection, lack of adequate PK properties to achieve efficacy, production of metabolites of the parent compound that can confound PK/PD understanding, and poor intrinsic efficacy.
d) Differentiation of compounds belonging to different chemical series – a particular compound series may have a better PK/PD (efficacy and potency) compared to the others.
The design of lead compounds is based largely on potency (MIC), in vitro ADME (Absorption, Distribution, Metabolism, Excretion) properties, and PK data and not so much on efficacy (Pharmacodynamics) data. Structure-Activity Relationships (SAR) are built based on structure and in vitro activity for biological potency; in vitro – in vivo relationships (IVIV) are built based on physico-chemical and ADME properties with PK. Based on these models, efficacy is predicted based in vitro biological potency (MIC) and in vivo PK (normally the concentration-time profile in plasma, serum). The general assumption is that if concentrations achieved in the animals are above the MIC then the compound will show efficacy. This assumption leads to optimization of lead compound(s) for potency (target, MIC), ADME and PK, with little information on how the PK is linked to efficacy. This approach has some limitations and can be misleading. The predictions of efficacy are made using MIC (measured in conditions where concentrations of the compound are held constant) and PK where concentrations change with time in the animals. This assumption does not take into account the location of the bacterial pathogen (harbouring the pharmacological target) in the body, the ability of the compound to reach the target, and dynamic concentrations of the compound in the body and at the target site, and the relationship between target binding and the time course of effect. Thus it does not predict the onset of the pharmacological effect (i.e. the time interval between dose administration and the time at which the effect is observed), the intensity of effect (the magnitude of the effect achieved at a given dose), and the duration of the effect (time period over which the effect is observed). Consequently when it comes to design of an efficacy experiment for a lead compound (also for clinical candidate in some cases) in an animal model of infection, the project is faced with the following questions: a) what should the dose(s) be? b) Frequency of dosing, i.e., how often should the compound be dosed; and c) what should the duration of dosing (treatment) be?
A METHOD FOR CHARACTERIZING THE PK/PD OF ANTI-BACTERIAL AGENTS AT LEAD IDENTIFICATION AND OPTIMIZATION STAGES
The following process can be used for characterization of PK/PD of the lead compound (s) in anti-bacterial drug discovery programs.
This process is illustrated with Ciprofloxacin (as the drug), Escherischia coli (as the infecting pathogen) and the neutropenic thigh infection mouse model (PD model).
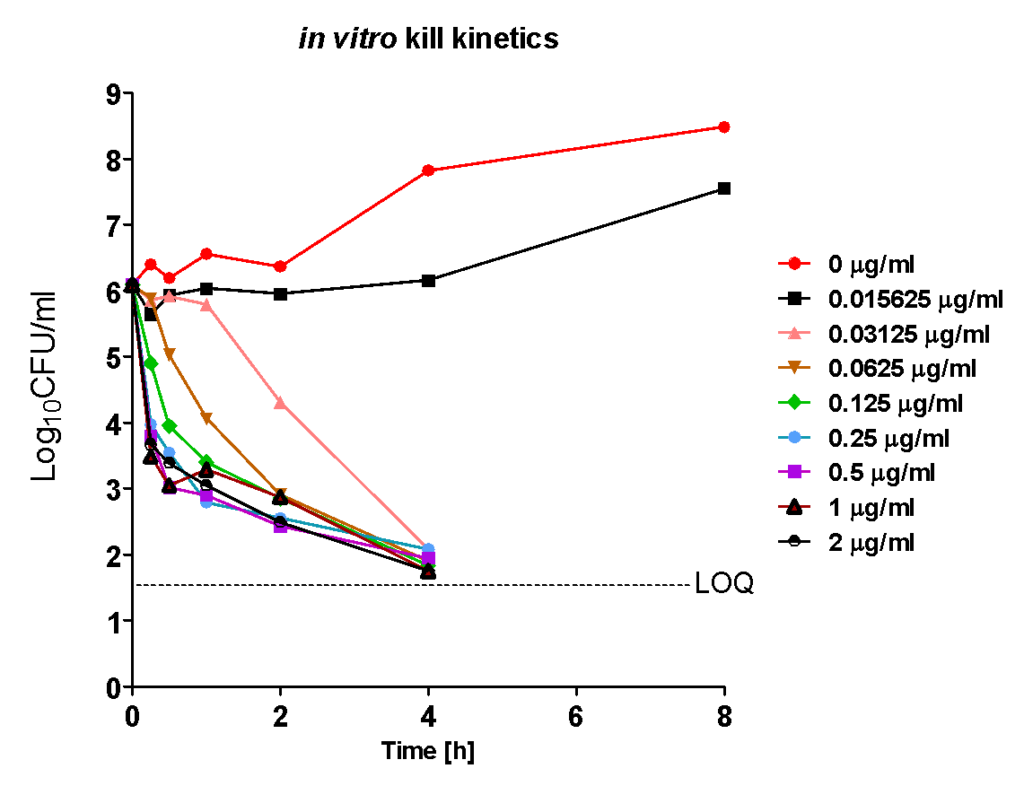
1. Determination of MIC and In vitro killing Kinetics of Ciprofloxacin on E. coli
The MIC was 0.03125 µg/ml. Ciprofloxacin displayed rapid concentration dependent killing kinetics on E.coli over a wide range of concentrations. The rate of killing increased with increasing concentration and reached saturation at higher concentrations. At 0.0156 µg/ml bacteria were prevented from growing (a measure of true MIC). The maximum efficacy was > 4 Log10CFU/ml reduction, at 4 h, at all the concentrations with the time taken to achieve the same effect (> 4 Log10CFU/ml) being inversely proportional to the concentration.

Although MIC is a measure of potency of a drug to inhibit a microorganism it does not indicate or measure the drug’s intrinsic efficacy (maximum inhibitory or killing effect, Imax) over a range of concentrations and the true potency (IC50, concentration at which 50% Imax is obtained). Efficacy and potency on a microorganism are intrinsic pharmacodynamic (PD) parameters of a drug that is determined by its chemical structure and its mechanism of action against a specific biochemical (pharmacological) target in the microorganism. Knowledge of pharmacodynamic parameters of lead candidates or series early on in drug discovery programs can help in differentiating and prioritizing lead compounds or series for further screening. Most importantly intrinsic PD parameters, when combined with PK and toxicity data, serve as a guide for medicinal chemists in lead optimization.
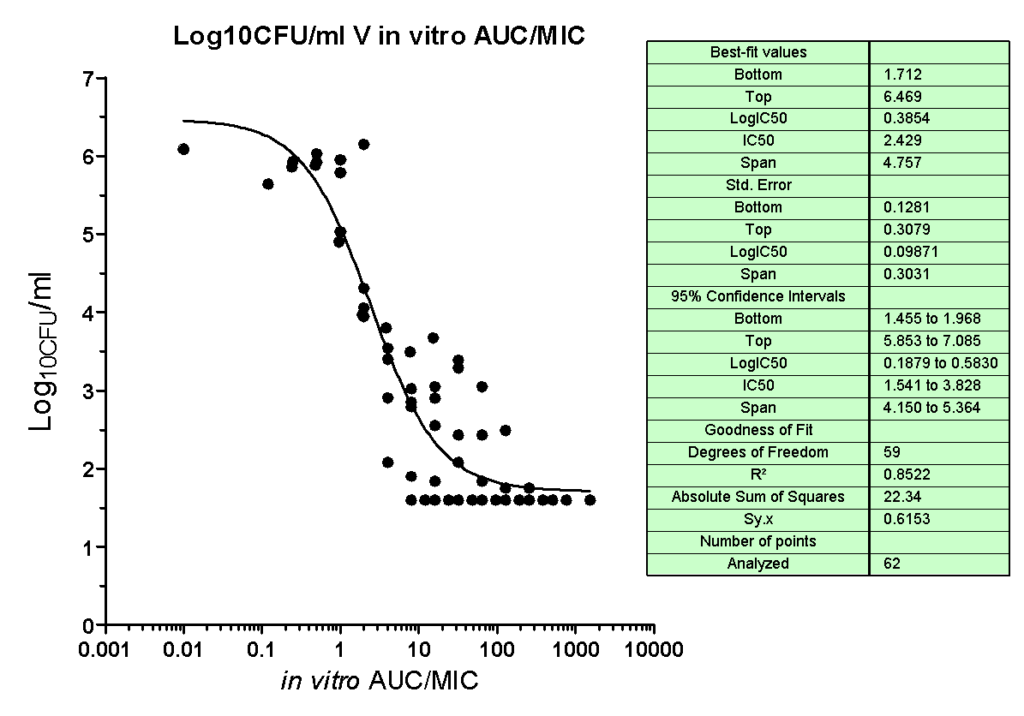
2. Estimating the Intrinsic anti-bacterial Efficacy and Potency of Ciprofloxacin in vitro
When the dose response of Ciprofloxacin is plotted for each time point, using the killing kinetics data, a dose response over a wide range of concentrations was seen at each time point, with net efficacy (maximum effect) increasing over time and the apparent potency being the highest at the last time point (leftward shift in IC50).


In summary, the in vitro killing pattern of Ciprofloxacin on E.coli was dependent on time and concentration, suggesting that exposure is linked to efficacy. The exposure in vitro (area under the concentration time curve=AUC) can be estimated as a product of concentration and time (C x t). AUC can be divided by the MIC to obtain AUC/MIC (10, 11). AUC/MIC is one of the PK/PD drivers of efficacy for anti-infective agents.

2. Characterizing Oral Pharmacokinetics of Ciprofloxacin in mice
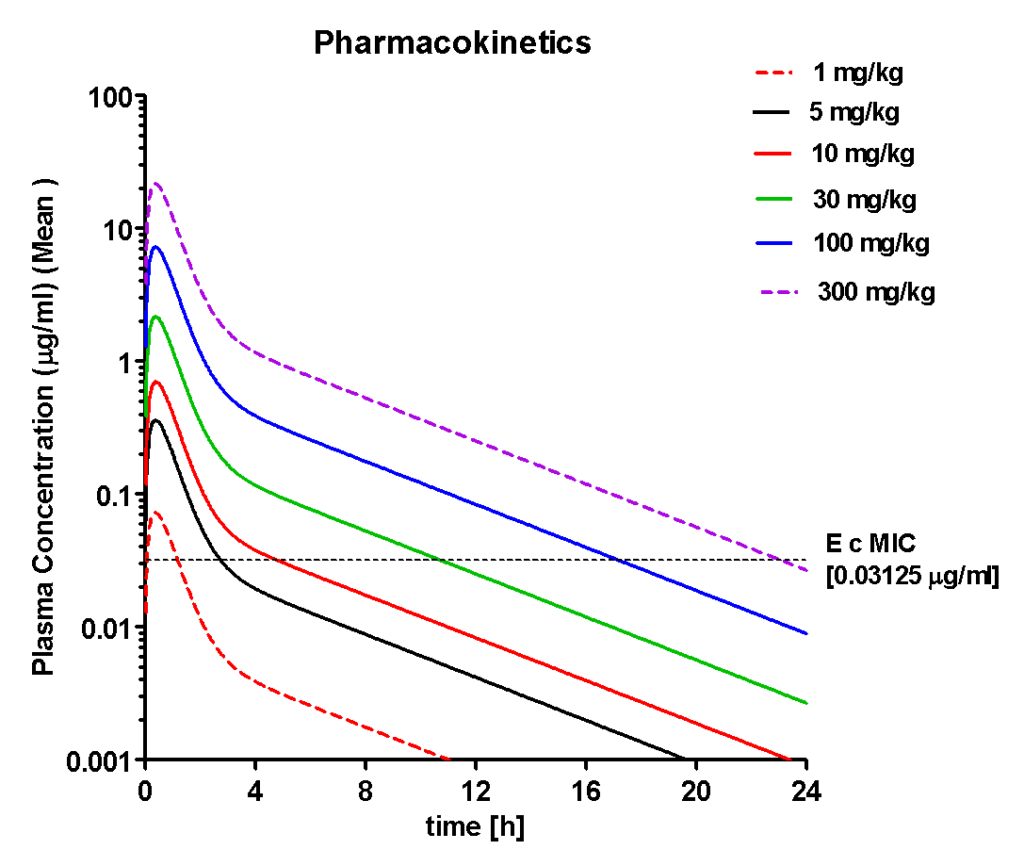
Following single dose administrations Ciprofloxacin showed dose proportional increases in plasma concentrations. At doses above 5 mg/kg, concentrations exceeded MIC for increasing periods with increasing
doses. This suggested that the concentrations in plasma may reach the site of infection in interstitial fluids (the site of infection in thighs of mice) assuming rapid equilibrium between plasma and interstitial fluid. The PK parameters measured in plasma of mice showed that the peak concentrations (Cmax) and area under the plasma concentration-time curve (AUC) achieved were proportional to dose (increased linearly with dose) and were above the MIC at 5, 10, 30, 100
and 300 mg/kg doses.
| Parameter | 5 mg/kg | 10 mg/kg | 30 mg/kg | 100 mg/kg | 300 mg/kg |
| AUC (h*µg/ml) | 0.56 | 1.09 | 3.33 | 11.102 | 33.31 |
| T1/2 (h) | 3.72 | 3.74 | 3.72 | 3.718 | 3.72 |
| Tmax (h) | 0.37 | 0.39 | 0.37 | 0.371 | 0.37 |
| Cmax (µg/ml) | 0.36 | 0.70 | 2.17 | 7.240 | 21.72 |
It should be pointed out that PK parameters are static and cannot predict how the time course of anti-bacterial effect (onset, intensity, duration of effect) can vary with varying plasma concentrations of the drug. It must be noted that MIC and killing kinetics are measured at static drug concentrations.
To understand the time course of pharmacodynamic activity (anti-bacterial effect) and the relationship between in vitro potency (MIC, killing kinetics) and PK, single dose time course of response (anti-bacterial effect) studies have to be performed.
3. Time course of Pharmacodynamics (anti-bacterial effect) of Ciprofloxacin in neutropenic thigh infection model in mice infected with E.coli

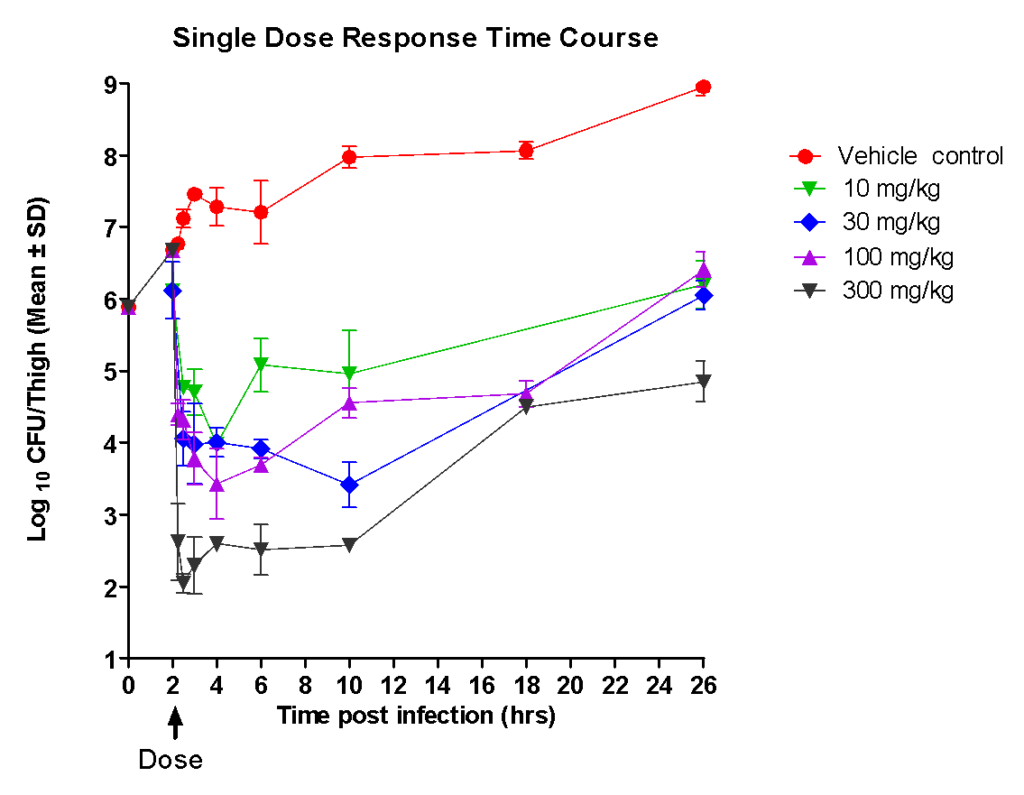
Following single increasing oral doses of Ciprofloxacin in neutropenic mice, infected with E.coli in thighs, the following was observed:
a) The onset of anti-bacterial effect (inhibition of growth or reduction in bacterial burden in thigh) appeared rapidly; b) The magnitude of Intensity of effect (rate and extent of killing) increased with dose – peak effect was observed almost immediately after dose.
c) Following rapid killing of bacteria, there was a flat lag phase (period of no growth) followed by a re-growth phase. The flat phase (bacteriostatic) lasted for approximately eight hours following peak.
d) Although the bacteria began to re-grow, the bacterial load at twenty four hours post dose was lower than the base line (bacterial load at the time of dose) at the highest dose, whereas the numbers reached baseline levels at the lower doses.
When the PK profile of Ciprofloxacin was compared with the Pharmacodynamic dose response data:
a) The peak concentrations (Cmax) achieved in plasma was associated with the time of peak intensity of effect implying that the concentrations reach the site of infection instantaneously;
b) The intensity of effect was proportional to the peak concentration in plasma;
c) Duration of effect appeared to be independent of the period above which the concentrations exceed the MIC in plasma;
Taking the PK and PD data together, it was clear that Ciprofloxacin has to be dosed twice a day (every 10-12 h) to achieve better efficacy.

Consistent with these observations Ciprofloxacin displayed significantly superior efficacy following twice a day oral administration when compared to single doses in a period of twenty four hours.
Thus for Ciprofloxacin, based on single dose response time studies, the following should be the experimental design for determining its intrinsic efficacy:
1. The highest dose should be 300 mg/kg as it was safe and showed the highest efficacy. Four more doses can be studied to obtain the dose response.
2. The dosing frequency should be twice in a period of 24 h. Note it can also be tested at three times dosing in a period of 24 h. Alternatively, it can be dosed to steady state at three dose levels.
3. The duration of treatment can be 24 h to achieve maximum efficacy (clearance of bacteria). However, maximum efficacy should be associated with complete clearance of bacteria. This can be tested by monitoring for the presence of bacteria following completion of treatment for a week.
4. PK measurements should be done in the same set of animals undergoing treatment to understand and confirm PK/PD relationships observed in the single dose PD studies.
4. Identification of the Pharmacokinetic/Pharmacodynamic (PK/PD) Index of Efficacy for Ciprofloxacin in the neutropenic thigh infection model in mice infected with E.coli
The PK/PD index of an anti-infective agent has been shown to be predictive of its efficacy in the clinic (3, 7, 8). The three main PK/PD indices that describe the efficacy of anti-bacterial drugs are fCmax/MIC, fAUC24/MIC and %T>MIC. Determining the PK/PD index and its magnitude to achieve efficacy in preclinical models of infection helps in setting PK/PD targets to achieve microbiological and clinical cure in the clinic (9).
To determine the PK/PD index for an anti-infective agent against a specific bacterial pathogen (s), Dose Fractionation studies are usually performed in the neutropenic thigh infection model in mice. Dose fractionation studies are based on the principle that when the same total dose is divided into one, two, three and four equal doses and administered, at five to six total doses, the relationship between the individual PK/PD index and efficacy can be determined.

AUC/MIC was the PK/PD index that best described the efficacy of Ciprofloxacin against E.coli in the neutropenic thigh infection model in mice. The efficacy (Imax) was 6.2 Log10CFU/thigh with potency (IC50) AUC/MIC=29.2. An AUC/MIC of >125 was associated with 3 Log10CFU/thigh reduction from baseline, consistent with clinical data. Cmax/MIC showed a lesser correlation and %T>MIC did not show significant correlation with efficacy.
The quantitative pharmacodynamic model of Ciprofloxacin in the neutropenic thigh infection model against E.coli is described by the following equation:
I = I0 – ((Imax* Log{AUC/MIC})/(LogIC50 + Log{AUC/MIC}))
Where
I= Inhibitory or killing effect at a given AUC/MIC
I0= Baseline bacterial load at start of therapy (6.1 Log10CFU/thigh)
Imax = Maximum difference between bacterial load in vehicle and at highest AUC/MIC at end of treatment (6.2 Log10CFU/thigh)
LogIC50 = Log AUC/MIC associated with half of maximal effect (1.46)
Identification of PK/PD index associated with efficacy for the lead compound is essential for the following reasons:
1. Helps identify PK and potency parameters to be optimized, along with safety, in the lead optimization phase.
2. Optimization for PK and potency can be performed without having to perform pharmacodynamic studies for all the compounds belonging to a specific chemical series. This is because the PK/PD index is the same for compounds belonging to a particular chemical class acting on the same biochemical target.
3. Helps in assessment of different lead series based on efficacy (Imax) and potency (IC50) of PK/PD index.
The optimized candidates can evaluated in dose fractionation studies against bacterial pathogens to confirm the PK/PD index and its magnitude associated with efficacy.
SUMMARY
The quantitative pharmacology of Ciprofloxacin against E.coli is shown below
| In vitro Pharmacodynamics | Estimate |
| MIC (µg/ml) | 0.03125 |
| Type of Killing | AUC Dependent |
| Efficacy (Imax), Log10CFU/ml reduction | 4.8 |
| IC50 (µg.h/ml) | 2.5 |
| In vivo PK/PD | Estimate |
| PK/PD Index associated with efficacy | AUC/MIC |
| Efficacy (Imax,24h), Log10CFU/ thigh reduction | 6.2 |
| AUC/MIC to achieve Imax, 24h | 1000 |
| Potency, AUC/MIC (IC50, 24h) | 29 |
| AUC/MIC for 3 Log10CFU/ thigh reduction from baseline | 600 |
In drug discovery projects, the steps described in this article can be used to establish quantitative pharmacological parameters for lead compounds early on in the project, which should form the basis for lead optimization. Knowledge of relationships between PK/PD index and magnitude of efficacy and potency can help in predicting efficacy of using MIC and PK parameters without having to perform efficacy studies in the lead optimization program. Such a process will enable faster turnaround of data to the project for decision making while saving resources and labour.
Determining the quantitative pharmacology of lead compounds belonging to different chemical series also helps in comparisons and prioritizing them for progression.
References:
1. Gabrielsson, J.; Green, A.R.; Quantitative pharmacology or pharmacokinetic pharmacodynamic integration should be a vital component in integrative pharmacology. J Pharmacol Exp Ther., 2009, 331(3), 767-74.
2. Craig, W.A. Pharmacokinetic/pharmacodynamic parameters: rationale for antibacterial dosing of mice and men. Clin Infect Dis., 1998, 26 (1), 1-10
3.Ambrose, P.G.; Bhavnani, S.M.; Rubino, C.M.; Louie, A.; Gumbo, T.; Forrest, A.; Drusano, G.L. Pharmacokinetics-pharmacodynamics of antimicrobial therapy: it’s not just for mice anymore. Clin Infect Dis., 2007, 44 (1), 79-8
4. Andes, D.; Craig, W.A. Animal model pharmacokinetics and pharmacodynamics: a critical review. Int J Antimicrob Agents., 2002, 19 (4), 261-8.
5. Drusano, G.L. Antimicrobial pharmacodynamics: critical interactions of ‘bug and drug’. Nat Rev Microbiol. 2004, 2(4), 289-300.
6. Andes, D.R.; Lepak, A.J. In vivo infection models in the pre-clinical pharmacokinetic/pharmacodynamic evaluation of antimicrobial agents. Curr Opin Pharmacol., 2017, 36, 94-99.
7. Forrest, A.; Nix, D.E.; Ballow, C.H.; Goss, T.F.; Birmingham, M,C.; Schentag. J.J. Pharmacodynamics of intravenous Ciprofloxacin in seriously ill patients. Antimicrob Agents Chemother., 1993, 37(5), 1073-81.
8. Preston, S.L.; Drusano, G.L.; Berman, A.L.; Fowler, C.L.; Chow, A.T, Dornseif, B.; Reichl, V.; Natarajan, J.; Corrado, M. Pharmacodynamics of levofloxacin: a new paradigm for early clinical trials. JAMA, 1998, 279 (2), 125-9.
9. Antibacterial Therapies for Patients With an Unmet Medical Need for the Treatment of Serious Bacterial Diseases: Guidance for Industry. U.S. Department of Health and Human Services Food and Drug Administration Center for Drug Evaluation and Research (CDER) August 2017. Clinical/Antimicrobial.
10. Jayaram R, Gaonkar S, Kaur P, Suresh BL, Mahesh BN, Jayashree R, Nandi V, Bharat S, Shandil RK, Kantharaj E, Balasubramanian V. 2003. Pharmacokinetics-pharmacodynamics of rifampin in an aerosol infection model of tuberculosis.
Antimicrob Agents Chemother. 47(7):2118-24
11. Jayaram R, Shandil RK, Gaonkar S, Kaur P, Suresh BL, Mahesh BN, Jayashree R, Nandi V, Bharath S, Kantharaj E, Balasubramanian V. 2004. Isoniazid pharmacokinetics-pharmacodynamics in an aerosol infection model of tuberculosis. Antimicrob Agents Chemother. 48(8):2951-7.
